Table of Contents
ToggleIntroduction:
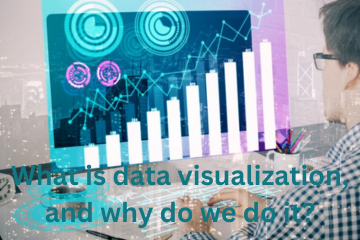
In today’s data-driven world, information is abundant, but making sense of it can be challenging. Data visualization, as an indispensable tool, bridges this gap by transforming raw data into visually appealing and insightful representations. This article explores the essence of data visualization, delving into its significance, techniques, and applications across various domains.
To learn more about Best Data Science in Bangalore. the best place is 360DigiTMG, with multiple awards in its name 360DigiTMG is the best place to start your Data Science career. Enroll now!
Section 1: Understanding Data Visualization:
It is the practice of presenting data in a visual format, such as charts, graphs, maps, or interactive dashboards, to facilitate understanding and gain insights. It leverages human visual perception to highlight patterns, trends, and relationships that might be otherwise hidden in complex datasets. By transforming numbers into intuitive visual elements, it enables effective communication and aids decision-making processes.
Section 2: The Importance of Data Visualization
2.1 Communicating Complex Information: Humans are inherently visual beings, and we process visual information more rapidly than text or numbers. visualization simplifies complex data, making it accessible to a wider audience and enhancing comprehension. It helps distill vast amounts of information into concise and easily digestible visual narratives.
2.2 Identifying Patterns and Trends: By representing data visually, patterns, trends, and correlations become apparent, facilitating data exploration and discovery. Visualizations enable analysts to identify outliers, clusters, and anomalies, leading to valuable insights that drive informed decision-making.
2.3 Enhancing Decision-Making: Data visualization empowers decision-makers by providing a clear overview of key metrics and performance indicators. It enables stakeholders to identify strengths, weaknesses, and opportunities, leading to data-driven strategies and actions.
360DigiTMG offers the Best Data Science in Chennai. To start a career in Data Science. Enroll now!
2.4 Storytelling and Engagement: Visuals have the power to captivate and engage audiences, making data storytelling more impactful. Combining data with compelling visuals helps create narratives that convey insights effectively, increasing audience comprehension and retention.
Section 3: Techniques and Best Practices
3.1 Choosing the Right Visualization: Different types of data require specific visual representations. Bar charts, line graphs, scatter plots, heat maps, and network diagrams are some of the many visualization techniques available. Understanding the data and its purpose is essential in selecting the appropriate visualization type.
3.2 Design Principles: Effective data visualization employs design principles to ensure clarity and accuracy. Elements such as color, size, typography, and layout significantly influence the interpretability of visualizations. Attention to detail and adherence to design principles are crucial for creating visually appealing and informative graphics.
3.3 Interactivity and User Experience: Interactive visualizations allow users to explore and interact with data dynamically. This engagement promotes a deeper understanding of the data by enabling users to drill down, filter, and manipulate visualizations based on their specific interests and needs.
3.4 Data Integrity and Ethical Considerations: Data visualization should prioritize accuracy and avoid misleading interpretations. Proper sourcing, data preprocessing, and appropriate context are essential to maintain integrity. Additionally, ethical considerations such as data privacy and security must be upheld throughout the visualization process.
Section 4: Applications of Data Visualization
4.1 Business and Marketing: Data empowers businesses to track performance metrics, analyze market trends, and make data-driven decisions. Marketing campaigns can leverage visualizations to understand customer behavior, identify target segments, and optimize strategies.
Learn the core concepts of Data Science Course video on Youtube:
4.2 Healthcare and Medicine: medical data aids in diagnosing diseases, tracking patient records, and identifying treatment patterns. Visualizations can reveal insights into disease patterns, the effectiveness of interventions, and public health trends.
360DigiTMG offers the Best Data Science in Pune. To start a career in Data Science. Enroll now!
4.3 Environmental Sciences: climate data, satellite imagery, and geographical information allows scientists and policymakers to understand environmental changes, assess risks, and design mitigation strategies. Visualizations help communicate complex environmental phenomena to a wider audience.
4.4 Social Sciences and Humanities: Visualization supports researchers in analyzing sociological, anthropological, and historical data. It uncovers patterns and trends in human behavior, cultural shifts, and societal dynamics.
Section 5: Challenges and Future Directions
While it’s offers immense potential, it also comes with certain challenges that need to be addressed for further advancements.
5.1 Big Data and Scalability: With the exponential growth of data, handling large datasets and ensuring scalability in visualization techniques pose significant challenges. Developing efficient algorithms and tools that can handle massive amounts of data without compromising performance will be crucial.
5.2 Interpreting Complex Relationships: In certain domains, such as network analysis or genomics, data often exhibits intricate and interconnected relationships. Effectively visualizing and interpreting these complex relationships require innovative visualization approaches that can capture the multidimensional nature of the data.
5.3 Real-Time Visualization: In dynamic environments where data is generated in real-time, the ability to visualize and analyze data as it is being generated becomes essential. Real-time visualization techniques and frameworks need to be developed to enable timely decision-making and actionable insights.
5.4 Ensuring Accessibility and Inclusivity: It should be designed with accessibility and inclusivity in mind. Visualizations need to be understandable to individuals with diverse backgrounds, including those with visual impairments. Providing alternative text, audio descriptions, and interactive features that support different modes of information consumption can enhance accessibility.
5.5 Ethical and Responsible Visualization: As data becomes more ubiquitous, ensuring ethical and responsible practices in data visualization is crucial. This includes addressing issues such as privacy concerns, biases in data representation, and the responsible use of visualizations to prevent misinterpretation or manipulation.
Looking ahead, the future of data visualization holds tremendous potential for innovation and advancements. Some key areas of development and exploration include:
5.6 Augmented and Virtual Reality (AR/VR): Immersive technologies like AR and VR have the potential to revolutionize data visualization. By creating interactive and immersive experiences, users can explore and interact with data in three-dimensional spaces, providing a new level of engagement and understanding.
5.7 Machine Learning and AI Integration: Integrating machine learning and AI algorithms with visualization can enhance the automated analysis and interpretation of data. This combination can enable systems to identify patterns, anomalies, and trends in data, leading to more accurate and actionable insights.
5.8 Natural Language Processing (NLP) and Visualization: NLP techniques can be used to extract information and insights from unstructured textual data. By combining NLP with data visualization, textual information can be transformed into visual representations, enabling better understanding and exploration of textual data.
5.9 Collaborative and Interactive Visualization: The ability for multiple users to collaborate and interact with visualizations in real-time opens up new possibilities. Collaborative visualization environments facilitate team collaboration, decision-making, and knowledge sharing, allowing stakeholders to collectively explore and analyze data.
Being a Data science is just a step away. Check out the Best Data Science in Hyderabad. Get trained by the alumni from IIT, IIM, and ISB.
Conclusion:
Data serves as a transformative tool in the realm of data analysis and decision-making. By harnessing the power of visual storytelling, it enables individuals and organizations to extract valuable insights, communicate effectively, and drive innovation across various domains. As the volume and complexity of data continue to grow, the art and science of data visualization will remain crucial in unlocking the potential of information and empowering individuals to make informed choices.
Data Science Placement Success Story
Data Science Training Institutes in Other Locations
Tirunelveli, Kothrud, Ahmedabad, Hebbal, Chengalpattu, Borivali, Udaipur, Trichur, Tiruchchirappalli, Srinagar, Ludhiana, Shimoga, Shimla, Siliguri, Rourkela, Roorkee, Pondicherry, Rajkot, Ranchi, Rohtak, Pimpri, Moradabad, Mohali, Meerut, Madurai, Kolhapur, Khammam, Jodhpur, Jamshedpur, Jammu, Jalandhar, Jabalpur, Gandhinagar, Ghaziabad, Gorakhpur, Gwalior, Ernakulam, Erode, Durgapur, Dombivli, Dehradun, Cochin, Bhubaneswar, Bhopal, Anantapur, Anand, Amritsar, Agra , Kharadi, Calicut, Yelahanka, Salem, Thane, Andhra Pradesh, Greater Warangal, Kompally, Mumbai, Anna Nagar, ECIL, Guduvanchery, Kalaburagi, Porur, Chromepet, Kochi, Kolkata, Indore, Navi Mumbai, Raipur, Coimbatore, Bhilai, Dilsukhnagar, Thoraipakkam, Uppal, Vijayawada, Vizag, Gurgaon, Bangalore, Surat, Kanpur, Chennai, Aurangabad, Hoodi,Noida, Trichy, Mangalore, Mysore, Delhi NCR, Chandigarh, Guwahati, Guntur, Varanasi, Faridabad, Thiruvananthapuram, Nashik, Patna, Lucknow, Nagpur, Vadodara, Jaipur, Hyderabad, Pune, Kalyan.
Data Analyst Courses In Other Locations
Tirunelveli, Kothrud, Ahmedabad, Chengalpattu, Borivali, Udaipur, Trichur, Tiruchchirappalli, Srinagar, Ludhiana, Shimoga, Shimla, Siliguri, Rourkela, Roorkee, Pondicherry, Rohtak, Ranchi, Rajkot, Pimpri, Moradabad, Mohali, Meerut, Madurai, Kolhapur, Khammam, Jodhpur, Jamshedpur, Jammu, Jalandhar, Jabalpur, Gwalior, Gorakhpur, Ghaziabad, Gandhinagar, Erode, Ernakulam, Durgapur, Dombivli, Dehradun, Bhubaneswar, Cochin, Bhopal, Anantapur, Anand, Amritsar, Agra, Kharadi, Calicut, Yelahanka, Salem, Thane, Andhra Pradesh, Warangal, Kompally, Mumbai, Anna Nagar, Dilsukhnagar, ECIL, Chromepet, Thoraipakkam, Uppal, Bhilai, Guduvanchery, Indore, Kalaburagi, Kochi, Navi Mumbai, Porur, Raipur, Vijayawada, Vizag, Surat, Kanpur, Aurangabad, Trichy, Mangalore, Mysore, Chandigarh, Guwahati, Guntur, Varanasi, Faridabad, Thiruvananthapuram, Nashik, Patna, Lucknow, Nagpur, Vadodara, Jaipur, Hyderabad, Pune, Kalyan, Delhi, Kolkata, Noida, Chennai, Bangalore, Gurgaon, Coimbatore.
Navigate To:
360DigiTMG – Data Analytics, Data Analyst Course Training in Bangalore
#62/1, Ground Floor, 1st Cross, 2nd Main, Ganganagar 560032, Bangalore, Karnataka
Phone: 1800-212-654321
Email: enquiry@360digitmg.com
Get Direction: data science courses in bangalore


